
As a companion to my column for the ASHA Leader App-Titude series, "Welcome to Science Class," this series explores how technology can serve as a context for teaching "language underpinnings" related to the social studies curriculum.
Have you ever heard of infographics? Infographics are visual representations of data and information, and have become popular as teaching tools, both as a presentation tool and creative context. Infographics boil down a particular topic to its essential information points, but can also contain higher-level analysis or evaluative content.
From a speech/language perspective, infographics can serve as tools that already display information broken down into key "language underpinnings," such as the expository text structures of list, sequence, description, compare/contrast, cause/effect, problem/solution, and persuasion. Additionally, they are by nature visual tools providing images and icons to support vocabulary, concepts and the relationships between them.
From a "Techie" perspective, infographics are free tools that are not only searchable via your iPad or Computer, displayable and zoomable (to limit information overload) through these same tools. They also are products that you can create (solo or with students) pretty easily with tech tools, thus providing them opportunity to practice the use of expository structures. Infographics can be saved in different ways, so do experiment with saving a PDF infographic to the iBooks app, an image infographic to your Photos app, or using on-screen navigation tools where ever they are housed.
To go with our theme of resources related to social studies, check out this excellent Pinterest board, Social Studies Infographics by Susan Pojer. My favorite: If you had to, could you survive doomsday?
You can also search Google for infographics on specific topics. A few great examples:
Latitude and Longitude (with key vocabulary and visuals)
An Infographic about the Greatest State (MA)! (with some fun lists and sequences)
Eight Great Ways to Be Thankful (with a social skills spin)
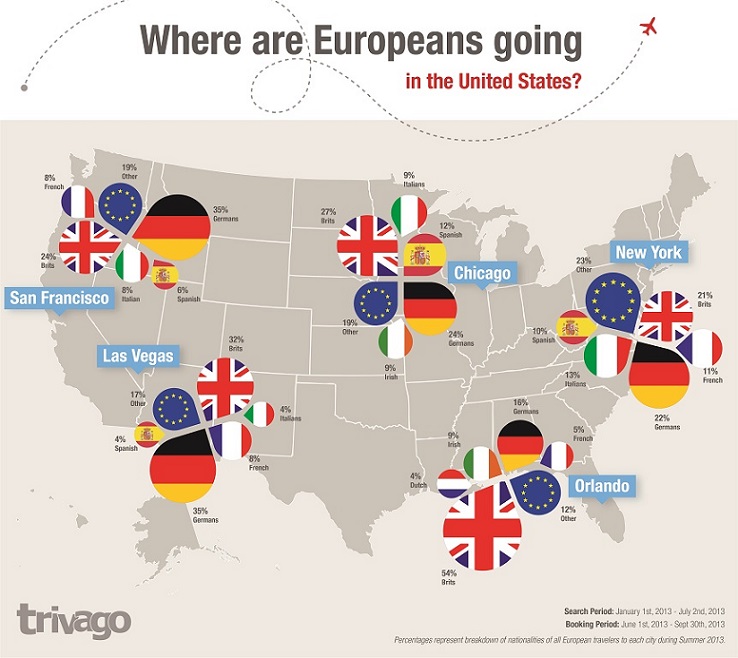
Where are Europeans going in the United States? (with context both around European flags and countries, and for making guesses about why these cities are so popular with tourists).
Also, check out my simple infographic I made with Piktochart!
Thursday, September 25, 2014
Subscribe to:
Post Comments (Atom)


No comments:
Post a Comment